UNITED STATES
SECURITIES AND EXCHANGE COMMISSION
WASHINGTON, D.C. 20549
FORM 8-K
CURRENT REPORT
PURSUANT TO SECTION 13 OR 15(d) OF THE
SECURITIES EXCHANGE ACT OF 1934
| Date of Report (Date of earliest event reported): | September 6, 2018 |
ABM Industries Incorporated
(Exact name of registrant as specified in its charter)
| Delaware | 1-8929 | 94-1369354 | ||
| (State or other jurisdiction | (Commission File | (IRS Employer | ||
| of incorporation) | Number) | Identification No.) |
| One Liberty Plaza, 7th Floor | ||
| New York, New York | 10006 | |
| (Address of principal executive offices) | (Zip Code) |
| Registrant’s telephone number, including area code | (212) 297-0200 |
N/A
(Former name or former address if changed since last report)
Check the appropriate box below if the Form 8-K filing is intended to simultaneously satisfy the filing obligation of the registrant under any of the following provisions:
| ¨ | Written communications pursuant to Rule 425 under the Securities Act (17 CFR 230.425) |
| ¨ | Soliciting material pursuant to Rule 14a-12 under the Exchange Act (17 CFR 240.14a-12) |
| ¨ | Pre-commencement communications pursuant to Rule 14d-2(b) under the Exchange Act (17 CFR 240.14d-2(b)) |
| ¨ | Pre-commencement communications pursuant to Rule 13e-4(c) under the Exchange Act (17 CFR 240.13e-4(c)) |
Indicate by check mark whether the registrant is an emerging growth company as defined in Rule 405 of the Securities Act of 1933 (§230.405 of this chapter) or Rule 12b-2 of the Securities Exchange Act of 1934 (§240.12b-2 of this chapter).
| ¨ | Emerging growth company |
| ¨ | If an emerging growth company, indicate by check mark if the registrant has elected not to use the extended transition period for complying with any new or revised financial accounting standards provided pursuant to Section 13(a) of the Exchange Act. |
| Item 2.02. | Results of Operations and Financial Condition. |
On September 6, 2018, ABM Industries Incorporated (the “Company”) issued a press release announcing financial results related to the third quarter of fiscal year 2018. A copy of the press release is attached as Exhibit 99.1, which is incorporated into this item by reference.
| Item 7.01. | Regulation FD |
As disclosed in the press release attached as Exhibit 99.1, the Company will hold a live web cast on September 7, 2018 relating to the Company’s financial results for the third quarter of fiscal year 2018. A copy of the slides to be presented at the Company’s web cast and discussed in the conference call relating to such financial results is being furnished as Exhibit 99.2 to this Form 8-K.
| Item 8.01. | Other Events. |
On September 6, 2018, the Company announced that the Board of Directors of the Company declared a quarterly dividend of $0.175 per share, payable on November 5, 2018 to stockholders of record on October 4, 2018. A copy of the press release announcing the declaration of the dividend is attached as Exhibit 99.1, which is incorporated into this item by reference.
| Item 9.01. | Financial Statements and Exhibits. |
| (d) | Exhibits. |
| 99.2 | Slides of ABM Industries Incorporated dated September 7, 2018. |
SIGNATURES
Pursuant to the requirements of the Securities Exchange Act of 1934, the Registrant has duly caused this report to be signed on its behalf by the undersigned hereunto duly authorized.
|
ABM INDUSTRIES INCORPORATED
|
|||||
| Dated: September 6, 2018 | By: | /s/ Barbara L. Smithers | |||
| Barbara L. Smithers | |||||
| Vice President, Deputy General Counsel and Assistant Secretary |
|||||
Exhibit 99.1

ABM INDUSTRIES ANNOUNCES RESULTS FOR
THIRD QUARTER FISCAL 2018
Reports Record Third Quarter Revenues of $1.6 billion
GAAP Continuing EPS of $0.51; Adjusted Continuing EPS of $0.57
Reaffirms Fiscal 2018 Guidance Outlook
Declaration of 210th Consecutive Quarterly Dividend
New York, NY - September 6, 2018 - ABM (NYSE: ABM), a leading provider of facility solutions, today announced financial results for the third quarter of fiscal 2018.
Scott Salmirs, President and Chief Executive Officer of ABM Industries, commented, "We delivered results that demonstrate our ability to navigate the current labor environment. We executed against our initiatives and performed in line with our expectations for the third quarter."
| Three Months Ended July 31, | Nine Months Ended July 31, | |||||||||||||||||||||||
| (in millions, except per share amounts) (unaudited) | 2018 | 2017 | Increase/ (Decrease) | 2018 | 2017 | Increase/ (Decrease) | ||||||||||||||||||
| Revenues | $ | 1,624.3 | $ | 1,318.4 | 23.2 | % | $ | 4,793.5 | $ | 3,955.6 | 21.2 | % | ||||||||||||
| Operating profit | $ | 48.1 | $ | 22.6 | NM | * | $ | 112.9 | $ | 97.4 | 15.9 | % | ||||||||||||
| Income from continuing operations | $ | 33.7 | $ | 32.9 | 2.5 | % | $ | 87.1 | $ | 80.6 | 8.0 | % | ||||||||||||
| Income from continuing operations per diluted share | $ | 0.51 | $ | 0.58 | (12.1 | )% | $ | 1.31 | $ | 1.42 | (7.7 | )% | ||||||||||||
| Adjusted income from continuing operations | $ | 38.0 | $ | 29.1 | 30.5 | % | $ | 86.6 | $ | 78.4 | 10.4 | % | ||||||||||||
| Adjusted income from continuing operations per diluted share | $ | 0.57 | $ | 0.51 | 11.8 | % | $ | 1.31 | $ | 1.39 | (5.8 | )% | ||||||||||||
| Net income | $ | 33.6 | $ | 32.9 | 2.2 | % | $ | 88.1 | $ | 7.4 | NM | * | ||||||||||||
| Net income per diluted share | $ | 0.51 | $ | 0.58 | (12.1 | )% | $ | 1.33 | $ | 0.13 | NM | * | ||||||||||||
| Net cash provided by operating activities of continuing operations | $ | 74.2 | $ | 32.4 | NM | * | $ | 206.4 | $ | 82.6 | NM | * | ||||||||||||
| Adjusted EBITDA | $ | 88.4 | $ | 57.3 | 54.3 | % | $ | 236.6 | $ | 166.0 | 42.6 | % | ||||||||||||
| Adjusted EBITDA margin | 5.4 | % | 4.3 | % | 110 bps | 4.9 | % | 4.2 | % | 70 bps | ||||||||||||||
| * Not meaningful (due to variance greater than or equal to +/-100%) |
This release refers to certain non-GAAP financial measures described as “Adjusted EBITDA” defined as earnings before income from discontinued operations, net of interest, taxes, depreciation and amortization and excluding items impacting comparability, "Adjusted EBITDA margin", “Adjusted income from continuing operations,” and “Adjusted income from continuing operations per diluted share”. These adjustments have been made with the intent of providing financial measures that give management and investors a more representative understanding of underlying operational results and trends as well as the Company’s operational performance. Management also uses Adjusted EBITDA as a basis for planning and forecasting future periods. Please refer to the accompanying financial schedules for supplemental financial data and corresponding reconciliation of these non-GAAP financial measures to certain GAAP financial measures. We round amounts in these schedules to millions and calculate all percentages and per-share data from the underlying whole-dollar amounts. As a result, certain amounts may not foot, crossfoot, or recalculate based on reported numbers due to rounding. Unless otherwise noted, all references to years are to our fiscal year, which ends on October 31.
| 1 |
Third Quarter Summary
| • | Record total revenue of $1,624.3 million, reflecting growth of 23.2%. |
| • | Revenue related to the 2017 acquisition of GCA Services Group ("GCA") of $260.0 million, predominantly reflected in the Education, Technology & Manufacturing, and Business & Industry segments. |
| • | Organic revenue growth of 4.5% primarily driven by growth within the Business & Industry segment, which includes a large UK-related contract win from September 2017. |
| • | Strong Technical Solutions organic revenue growth of 14.0%, which drove greater operating leverage. |
| • | Aviation operating results for the third quarter of fiscal 2018 reflect the absence of a specific, unprofitable contract, which was terminated and disclosed during the third quarter of fiscal 2017. |
| • | Income from continuing operations of $33.7 million, or $0.51 per diluted share, was impacted by higher amortization, interest expense and higher share count related to the GCA acquisition. |
| • | Adjusted income from continuing operations of $38.0 million, or $0.57 per diluted share, resulting in an 11.8% increase versus last year. |
| • | Adjusted EBITDA increased 54.3% to $88.4 million compared to $57.3 million, reflecting the Company's GCA acquisition in 2017. These results led to an adjusted EBITDA margin of 5.4% versus 4.3% last year. |
| • | Net cash provided by continuing operating activities increased to $74.2 million for the quarter, reflecting better working capital management and the contribution from GCA. |
| • | Overall results reflect the absence of Government Services, which was sold on May 31, 2017. |
Third Quarter Results
For the third quarter of fiscal 2018, the Company achieved record revenues of approximately $1.6 billion driven by the acquisition of GCA, and organic growth of 4.5% primarily within the Business & Industry segment, Technical Solutions and Technology & Manufacturing segments. Organic growth was partially offset by the Aviation segment. The GCA acquisition provided $260.0 million of incremental revenues, which is predominantly reflected in the Education, Technology & Manufacturing, and Business & Industry segments in the amounts of $143.5 million, $59.6 million, and $45.3 million, respectively.
On a GAAP basis, income from continuing operations was $33.7 million, or $0.51 per diluted share, compared to income from continuing operations of $32.9 million, or $0.58 per diluted share last year. Income from continuing operations for the third quarter of fiscal 2017 reflected favorable items impacting comparability driven by expiring statutes of limitations for certain tax positions.
Adjusted income from continuing operations for the third quarter of 2018 was $38.0 million, or $0.57 per diluted share, compared to $29.1 million, or $0.51 per diluted share for the third quarter of fiscal 2017. Adjusted results exclude items impacting comparability. A description of items impacting comparability can be found in the "Reconciliation of Non-GAAP Financial Measures" table.
| 2 |
Total income from continuing operations for the quarter on both a GAAP and adjusted basis reflects revenue contribution due to the Company's overall growth, as well as the benefit of a reduced overall corporate tax rate as a result of the U.S. Tax Cuts and Jobs Act of 2017. These results were partially offset by GCA acquisition-related expenses, namely amortization and interest. Additionally, the impact of higher wage and overtime costs impacted the Company, although some of these costs were partially mitigated by the execution of planned cost control measures.
Weighted average shares outstanding on a diluted basis for the quarter were 66.3 million, an increase of approximately 10 million shares, primarily due to the GCA transaction.
Net income for the third quarter of 2018 was $33.6 million, or $0.51 per diluted share, compared to net income of $32.9 million, or $0.58 per diluted share last year.
Adjusted EBITDA for the quarter was $88.4 million compared to $57.3 million in the third quarter of fiscal 2017, primarily as a result of the GCA acquisition. Adjusted EBITDA margin for the quarter was 5.4% versus 4.3% last year. Adjusted results exclude items impacting comparability. A description of items impacting comparability can be found in the "Reconciliation of Non-GAAP Financial Measures" table.
Mr. Salmirs continued, "At this time, we continue to experience the impact from a tighter labor market and we do not expect to see a material change in this trend in the current macroeconomic environment. Our teams have been implementing mitigation plans, including intensified labor management and cost containment. Concurrently, we are executing on key process and IT initiatives that will enable us to run our business with more agility and efficiency over the long term."
Liquidity & Capital Structure
The Company ended the quarter with total debt, including standby letters of credit, of $1.2 billion.
Total debt to proforma adjusted EBITDA was approximately 3.65x, reflecting the Company's focus on free cash flow conversion as well as its continued reduction of leverage to more historical levels by fiscal 2020.
In addition, the Company paid a quarterly cash dividend of $0.175 per common share for a total distribution of $11.5 million.
Declaration of Quarterly Cash Dividend
The Company also announced that the Board of Directors has declared a cash dividend of $0.175 per common share payable on November 5, 2018 to shareholders of record on October 4, 2018. This will be the Company's 210th consecutive quarterly cash dividend.
Guidance
The Company is reaffirming its outlook for fiscal 2018. The Company continues to expect GAAP income from continuing operations of $1.73 to $1.83 per diluted share. Excluding items impacting comparability, adjusted income from continuing operations remains in the range of $1.85 to $1.95 per diluted share for the 2018 fiscal year. The Company's guidance only includes the discrete tax items related to the 2018 Work Opportunity Tax Credits and anticipated excess tax benefits on stock-based awards.
| 3 |
Mr. Salmirs concluded, "Our ability to reiterate our guidance outlook for the year despite the current labor pressures we are facing demonstrates the strength of our teams as we focused on the operating levers within our control to drive results. We have also been working diligently to advance several key technology implementations that will be launching over the next six to twelve months. They are focused on several important areas, including human capital management and time and attendance, where it is crucial to be best-in-class given the near term labor environment. We will also be converging and upgrading our ERP systems. Our track record of execution, in addition to the process improvements from these new tools, will further strengthen our scale, and ensure our formidable position as a market leader."
Conference Call Information
ABM will host its quarterly conference call for all interested parties on Friday, September 7, 2018 at 8:30 AM (ET). The live conference call can be accessed via audio webcast under the "Events & Presentations" section of the Company's Investor Relations website, located at investor.abm.com, or by dialing (877) 451-6152 approximately 15 minutes prior to the scheduled time.
A supplemental presentation will accompany the webcast on the Company's website.
A replay will be available approximately two hours after the recording through September 14, 2018 and can be accessed by dialing (844) 512-2921 and then entering ID #13682731. An archive will also be available on the ABM website for 90 days.
ABOUT ABM
ABM (NYSE: ABM) is a leading provider of facility solutions with revenues of approximately $5.5 billion and more than 130,000 employees in 350+ offices throughout the United States and various international locations. ABM’s comprehensive capabilities include janitorial, electrical & lighting, energy solutions, facilities engineering, HVAC & mechanical, landscape & turf, mission critical solutions and parking, provided through stand-alone or integrated solutions. ABM provides custom facility solutions in urban, suburban and rural areas to properties of all sizes - from schools and commercial buildings to hospitals, data centers, manufacturing plants and airports. ABM Industries Incorporated, which operates through its subsidiaries, was founded in 1909. For more information, visit www.abm.com.
| 4 |
Cautionary Statement under the Private Securities Litigation Reform Act of 1995
This press release contains both historical and forward-looking statements regarding ABM Industries Incorporated (“ABM”) and its subsidiaries (collectively referred to as “ABM,” “we,” “us,” “our,” or the “Company”). We make forward-looking statements related to future expectations, estimates, and projections that are uncertain and often contain words such as “anticipate,” “believe,” “could,” “estimate,” “expect,” “forecast,” “intend,” “likely,” “may,” “outlook,” “plan,” “predict,” “should,” “target,” or other similar words or phrases. These statements are not guarantees of future performance and are subject to known and unknown risks, uncertainties, and assumptions that are difficult to predict. Particular risks and uncertainties that could cause our actual results to be materially different from those expressed in our forward-looking statements include: (1) we may not realize the growth opportunities and cost synergies that are anticipated from the acquisition of GCA Services Group (“GCA”); (2) we have incurred a substantial amount of debt to complete the acquisition of GCA. To service our debt we will require a significant amount of cash. Our ability to generate cash depends on many factors beyond our control. We also depend on the profitability of our subsidiaries to satisfy our cash needs. If we cannot generate the required cash, we may not be able to make the necessary payments required to service our indebtedness or we may be required to suspend certain discretionary payments, including our dividend; (3) changes to our businesses, operating structure, financial reporting structure, or personnel relating to the implementation of our 2020 Vision strategic transformation initiative, including our move to our Enterprise Services Center, may not have the desired effects on our financial condition and results of operations; (4) our success depends on our ability to gain profitable business despite competitive pressures and to preserve long-term client relationships; (5) our business success depends on our ability to attract and retain qualified personnel and senior management; (6) our use of subcontractors or joint venture partners to perform work under customer contracts exposes us to liability and financial risk; (7) our international business involves risks different from those we face in the United States that could have an effect on our results of operations and financial condition; (8) unfavorable developments in our class and representative actions and other lawsuits alleging various claims could cause us to incur substantial liabilities; (9) we insure our insurable risks through a combination of insurance and self-insurance and we retain a substantial portion of the risk associated with expected losses under these programs, which exposes us to volatility associated with those risks, including the possibility that changes in estimates of ultimate insurance losses could result in a material charge against our earnings; (10) our risk management and safety programs may not have the intended effect of reducing our liability for personal injury or property loss; (11) impairment of goodwill and long-lived assets could have a material adverse effect on our financial condition and results of operations; (12) changes in general economic conditions, including changes in energy prices, government regulations, or changing consumer preferences, could reduce the demand for facility services and, as a result, reduce our earnings and adversely affect our financial condition; (13) our income tax provision and income tax liabilities could be adversely affected by the jurisdictional mix of earnings, changes in valuations of deferred tax assets and liabilities, and changes in tax treaties, laws, and regulations, including the U.S. Tax Cuts and Jobs Act of 2017, which effected significant changes to the U.S. corporate income tax system; (14) we could be subject to cyber-security risks, information technology interruptions, and business continuity risks; (15) a significant number of our employees are covered by collective bargaining agreements that could expose us to potential liabilities in relationship to our participation in multiemployer pension plans, requirements to make contributions to other benefit plans, and the potential for strikes, work slowdowns or similar activities, and union-organizing drives; (16) if we fail to maintain proper and effective internal control over financial reporting in the future, our ability to produce accurate and timely financial statements could be negatively impacted, which could harm our operating results and investors’ perceptions of our company and, as a result, the value of our common stock; (17) our business may be negatively impacted by adverse weather conditions; (18) catastrophic events, disasters, and terrorist attacks could disrupt our services; and (19) actions of activist investors could disrupt our business. The list of factors above is illustrative and by no means exhaustive. Additional information regarding these and other risks and uncertainties we face is contained in our Annual Report on Form 10-K for the year ended October 31, 2017 and in other reports we file from time to time with the Securities and Exchange Commission (including all amendments to those reports). We urge readers to consider these risks and uncertainties in evaluating our forward-looking statements. We caution readers not to place undue reliance upon any such forward-looking statements, which speak only as of the date made. We undertake no obligation to publicly update any forward-looking statements, whether as a result of new information, future events, or otherwise, except as required by law.
| 5 |
Use of Non-GAAP Financial Information
To supplement ABM’s consolidated financial information, the Company has presented income from continuing operations and income from continuing operations per diluted share as adjusted for items impacting comparability, for the third quarter of fiscal years 2018 and 2017. These adjustments have been made with the intent of providing financial measures that give management and investors a better understanding of the underlying operational results and trends as well as ABM’s operational performance. In addition, the Company has presented earnings before income from discontinued operations, net of taxes, interest, taxes, depreciation and amortization and excluding items impacting comparability (adjusted EBITDA) for the third quarter of fiscal years 2018 and 2017. Adjusted EBITDA is among the indicators management uses as a basis for planning and forecasting future periods. The presentation of these non-GAAP financial measures is not meant to be considered in isolation or as a substitute for financial statements prepared in accordance with accounting principles generally accepted in the United States of America. (See accompanying financial tables for supplemental financial data and corresponding reconciliations to certain GAAP financial measures.)
| Contact: | |
| Investor & Media Relations: | Susie A. Choi |
| (212) 297-9721 | |
| susie.choi@abm.com |
| 6 |
Financial Schedules
ABM INDUSTRIES INCORPORATED AND SUBSIDIARIES
CONSOLIDATED INCOME STATEMENT INFORMATION (UNAUDITED)
| Three Months Ended July 31, | ||||||||||||
| (in millions, except per share amounts) | 2018 | 2017 | Increase / (Decrease) | |||||||||
| Revenues | $ | 1,624.3 | $ | 1,318.4 | 23.2 | % | ||||||
| Operating expenses | 1,446.7 | 1,184.5 | 22.1 | % | ||||||||
| Selling, general and administrative expenses | 110.0 | 101.3 | 8.6 | % | ||||||||
| Restructuring and related expenses | 2.9 | 5.2 | (43.4 | )% | ||||||||
| Amortization of intangible assets | 16.6 | 6.1 | NM | * | ||||||||
| Impairment recovery and gain on sale | — | (1.1 | ) | NM | * | |||||||
| Operating profit | 48.1 | 22.6 | NM | * | ||||||||
| Income from unconsolidated affiliates, net | 1.0 | 1.2 | (22.2 | )% | ||||||||
| Interest expense | (12.9 | ) | (2.8 | ) | NM | * | ||||||
| Income from continuing operations before income taxes | 36.1 | 21.0 | 72.1 | % | ||||||||
| Income tax (provision) benefit | (2.4 | ) | 11.9 | NM | * | |||||||
| Income from continuing operations | 33.7 | 32.9 | 2.5 | % | ||||||||
| Loss from discontinued operations, net of taxes | (0.1 | ) | — | NM | * | |||||||
| Net income | 33.6 | 32.9 | 2.2 | % | ||||||||
| Net income per common share — Basic | ||||||||||||
| Income from continuing operations | $ | 0.51 | $ | 0.59 | (13.6 | )% | ||||||
| Income (loss) from discontinued operations | — | — | NM | * | ||||||||
| Net income | $ | 0.51 | $ | 0.59 | (13.6 | )% | ||||||
| Net income per common share — Diluted | ||||||||||||
| Income from continuing operations | $ | 0.51 | $ | 0.58 | (12.1 | )% | ||||||
| Income (loss) from discontinued operations | — | — | NM | * | ||||||||
| Net income | $ | 0.51 | $ | 0.58 | (12.1 | )% | ||||||
| Weighted-average common and common equivalent shares outstanding | ||||||||||||
| Basic | 66.1 | 56.1 | ||||||||||
| Diluted | 66.3 | 56.6 | ||||||||||
| Dividends declared per common share | $ | 0.175 | $ | 0.170 | ||||||||
* Not meaningful (due to variance greater than or equal to +/-100%)
| 7 |
ABM INDUSTRIES INCORPORATED AND SUBSIDIARIES
CONSOLIDATED INCOME STATEMENT INFORMATION (UNAUDITED)
| Nine Months Ended July 31, | ||||||||||||
| (in millions, except per share amounts) | 2018 | 2017 | Increase / (Decrease) | |||||||||
| Revenues | $ | 4,793.5 | $ | 3,955.6 | 21.2 | % | ||||||
| Operating expenses | 4,281.8 | 3,544.1 | 20.8 | % | ||||||||
| Selling, general and administrative expenses | 326.8 | 299.2 | 9.2 | % | ||||||||
| Restructuring and related expenses | 22.5 | 16.0 | 41.1 | % | ||||||||
| Amortization of intangible assets | 49.5 | 17.4 | NM | * | ||||||||
| Impairment recovery and gain on sale | — | (18.5 | ) | NM | * | |||||||
| Operating profit | 112.9 | 97.4 | 15.9 | % | ||||||||
| Income from unconsolidated affiliates, net | 2.5 | 3.6 | (29.3 | )% | ||||||||
| Interest expense | (41.0 | ) | (9.1 | ) | NM | * | ||||||
| Income from continuing operations before income taxes | 74.4 | 91.9 | (19.1 | )% | ||||||||
| Income tax benefit (provision) | 12.7 | (11.3 | ) | NM | * | |||||||
| Income from continuing operations | 87.1 | 80.6 | 8.0 | % | ||||||||
| Income (loss) from discontinued operations, net of taxes | 1.0 | (73.2 | ) | NM | * | |||||||
| Net income | 88.1 | 7.4 | NM | * | ||||||||
| Net income per common share — Basic | ||||||||||||
| Income from continuing operations | $ | 1.32 | $ | 1.44 | (8.3 | )% | ||||||
| Income (loss) from discontinued operations | 0.02 | (1.31 | ) | NM | * | |||||||
| Net income | $ | 1.33 | $ | 0.13 | NM | * | ||||||
| Net income per common share — Diluted | ||||||||||||
| Income from continuing operations | $ | 1.31 | $ | 1.42 | (7.7 | )% | ||||||
| Income (loss) from discontinued operations | 0.02 | (1.29 | ) | NM | * | |||||||
| Net income | $ | 1.33 | $ | 0.13 | NM | * | ||||||
| Weighted-average common and common equivalent shares outstanding | ||||||||||||
| Basic | 66.0 | 56.0 | ||||||||||
| Diluted | 66.3 | 56.6 | ||||||||||
| Dividends declared per common share | $ | 0.525 | $ | 0.510 | ||||||||
| * Not meaningful (due to variance greater than or equal to +/-100%) |
| 8 |
ABM INDUSTRIES INCORPORATED AND SUBSIDIARIES
SELECTED CONSOLIDATED CASH FLOW INFORMATION (UNAUDITED)
| Three Months Ended July 31, | ||||||||
| (in millions) | 2018 | 2017 | ||||||
| Net cash provided by operating activities of continuing operations | $ | 74.2 | $ | 32.4 | ||||
| Net cash used in operating activities of discontinued operations | (0.1 | ) | (55.2 | ) | ||||
| Net cash provided by (used in) operating activities | $ | 74.1 | $ | (22.8 | ) | |||
| Proceeds from sale of business | — | 35.5 | ||||||
| Other | (11.9 | ) | (13.4 | ) | ||||
| Net cash (used in) provided by investing activities | $ | (11.9 | ) | $ | 22.1 | |||
| Proceeds from issuance of share-based compensation awards, net of taxes withheld | 0.3 | 1.3 | ||||||
| Dividends paid | (11.5 | ) | (9.5 | ) | ||||
| Borrowings from credit facility | 418.5 | 229.1 | ||||||
| Repayment of borrowings from credit facility | (501.1 | ) | (242.3 | ) | ||||
| Changes in book cash overdrafts | 5.9 | 9.3 | ||||||
| Financing of energy savings performance contracts | 3.5 | 4.1 | ||||||
| Repayment of capital lease obligations | (0.6 | ) | (0.2 | ) | ||||
| Net cash used in by financing activities | $ | (85.0 | ) | $ | (8.2 | ) | ||
| Effect of exchange rate changes on cash and cash equivalents | (0.9 | ) | 0.9 | |||||
| 9 |
ABM INDUSTRIES INCORPORATED AND SUBSIDIARIES
SELECTED CONSOLIDATED CASH FLOW INFORMATION (UNAUDITED)
| Nine Months Ended July 31, | ||||||||
| (in millions) | 2018 | 2017 | ||||||
| Net cash provided by operating activities of continuing operations | $ | 206.4 | $ | 82.6 | ||||
| Net cash provided by (used in) operating activities of discontinued operations | 1.0 | (57.2 | ) | |||||
| Net cash provided by operating activities | $ | 207.4 | $ | 25.3 | ||||
| Purchase of businesses, net of cash acquired | — | (18.6 | ) | |||||
| (Adjustments to) and proceeds from sale of business | (1.9 | ) | 35.5 | |||||
| Other | (34.3 | ) | (40.8 | ) | ||||
| Net cash used in investing activities | $ | (36.3 | ) | $ | (23.9 | ) | ||
| (Taxes withheld) and proceeds from issuance of share-based compensation awards, net | (0.3 | ) | 2.0 | |||||
| Repurchases of common stock | — | (7.9 | ) | |||||
| Dividends paid | (34.5 | ) | (28.4 | ) | ||||
| Deferred financing costs paid | (0.1 | ) | — | |||||
| Borrowings from credit facility | 887.0 | 671.0 | ||||||
| Repayment of borrowings from credit facility | (1,042.1 | ) | (674.6 | ) | ||||
| Changes in book cash overdrafts | 1.1 | 26.5 | ||||||
| Financing of energy savings performance contracts | 3.5 | 6.8 | ||||||
| Payment of contingent consideration | — | (3.8 | ) | |||||
| Repayment of capital lease obligations | (2.3 | ) | (0.3 | ) | ||||
| Net cash used in financing activities | $ | (187.7 | ) | $ | (8.7 | ) | ||
| Effect of exchange rate changes on cash and cash equivalents | (0.2 | ) | 1.5 | |||||
| 10 |
ABM INDUSTRIES INCORPORATED AND SUBSIDIARIES
CONDENSED CONSOLIDATED BALANCE SHEET INFORMATION (UNAUDITED)
| (in millions) | July 31, 2018 | October 31, 2017 | ||||||
| ASSETS | ||||||||
| Current assets | ||||||||
| Cash and cash equivalents | $ | 46.0 | $ | 62.8 | ||||
| Trade accounts receivable, net of allowances | 1,046.0 | 1,038.1 | ||||||
| Prepaid expenses | 110.4 | 101.8 | ||||||
| Other current assets | 38.2 | 32.8 | ||||||
| Total current assets | 1,240.6 | 1,235.5 | ||||||
| Other investments | 17.4 | 17.6 | ||||||
| Property, plant and equipment, net of accumulated depreciation | 142.8 | 143.1 | ||||||
| Other intangible assets, net of accumulated amortization | 369.6 | 430.1 | ||||||
| Goodwill | 1,864.3 | 1,864.2 | ||||||
| Other noncurrent assets | 105.8 | 122.1 | ||||||
| Total assets | $ | 3,740.4 | $ | 3,812.6 | ||||
| LIABILITIES AND STOCKHOLDERS' EQUITY | ||||||||
| Current liabilities | ||||||||
| Current portion of long-term debt, net | $ | 27.0 | $ | 16.9 | ||||
| Trade accounts payable | 224.8 | 230.8 | ||||||
| Accrued compensation | 170.6 | 159.9 | ||||||
| Accrued taxes—other than income | 63.8 | 52.5 | ||||||
| Insurance claims | 115.7 | 112.5 | ||||||
| Income taxes payable | 5.2 | 13.4 | ||||||
| Other accrued liabilities | 162.7 | 171.8 | ||||||
| Total current liabilities | 769.8 | 757.8 | ||||||
| Long-term debt, net | 998.4 | 1,161.3 | ||||||
| Deferred income tax liability, net | 43.5 | 57.3 | ||||||
| Noncurrent insurance claims | 393.6 | 382.9 | ||||||
| Other noncurrent liabilities | 60.2 | 61.3 | ||||||
| Noncurrent income taxes payable | 18.4 | 16.3 | ||||||
| Total liabilities | 2,283.9 | 2,436.9 | ||||||
| Total stockholders' equity | 1,456.4 | 1,375.7 | ||||||
| Total liabilities and stockholders’ equity | $ | 3,740.4 | $ | 3,812.6 | ||||
| 11 |
ABM INDUSTRIES INCORPORATED AND SUBSIDIARIES
REVENUES AND OPERATING PROFIT BY SEGMENT (UNAUDITED)
| Three Months Ended July 31, | ||||||||||||
| (in millions) | 2018 | 2017 | Increase/ (Decrease) | |||||||||
| Revenues | ||||||||||||
| Business & Industry | $ | 735.2 | $ | 652.6 | 12.7 | % | ||||||
| Aviation | 256.8 | 258.9 | (0.8 | )% | ||||||||
| Technology & Manufacturing | 230.8 | 161.5 | 42.9 | % | ||||||||
| Education | 210.9 | 67.3 | NM | * | ||||||||
| Technical Solutions | 121.6 | 106.7 | 14.0 | % | ||||||||
| Healthcare | 69.1 | 59.3 | 16.5 | % | ||||||||
| Government Services | — | 12.3 | NM | * | ||||||||
| Total revenues | $ | 1,624.3 | $ | 1,318.4 | 23.2 | % | ||||||
| Operating profit (loss) | ||||||||||||
| Business & Industry | $ | 38.9 | $ | 37.3 | 4.3 | % | ||||||
| Aviation | 9.7 | 5.4 | 80.3 | % | ||||||||
| Technology & Manufacturing | 16.9 | 11.0 | 53.6 | % | ||||||||
| Education | 12.0 | 3.9 | NM | * | ||||||||
| Technical Solutions | 11.9 | 9.4 | 26.1 | % | ||||||||
| Healthcare | 2.5 | 2.8 | (8.9 | )% | ||||||||
| Government Services | — | 1.7 | NM | * | ||||||||
| Corporate | (42.7 | ) | (47.5 | ) | (10.1 | )% | ||||||
| Adjustment for income from unconsolidated affiliates, net, included in Aviation and Government Services | (0.9 | ) | (1.0 | ) | (16.8 | )% | ||||||
| Adjustment for tax deductions for energy efficient government buildings, included in Technical Solutions | (0.3 | ) | (0.4 | ) | (21.1 | )% | ||||||
| Total operating profit | 48.1 | 22.6 | NM | * | ||||||||
| Income from unconsolidated affiliates, net | 1.0 | 1.2 | (22.2 | )% | ||||||||
| Interest expense | (12.9 | ) | (2.8 | ) | NM | * | ||||||
| Income from continuing operations before income taxes | 36.1 | 21.0 | 72.1 | % | ||||||||
| Income tax (provision) benefit | (2.4 | ) | 11.9 | NM | * | |||||||
| Income from continuing operations | 33.7 | 32.9 | 2.5 | % | ||||||||
| Loss from discontinued operations, net of taxes | (0.1 | ) | — | NM | * | |||||||
| Net income | $ | 33.6 | $ | 32.9 | 2.2 | % | ||||||
* Not meaningful (due to variance greater than or equal to +/-100%)
| 12 |
ABM INDUSTRIES INCORPORATED AND SUBSIDIARIES
REVENUES AND OPERATING PROFIT BY SEGMENT (UNAUDITED)
| Nine Months Ended July 31, | ||||||||||||
| (in millions) | 2018 | 2017 | Increase/ (Decrease) | |||||||||
| Revenues | ||||||||||||
| Business & Industry | $ | 2,180.5 | $ | 1,945.6 | 12.1 | % | ||||||
| Aviation | 758.3 | 722.9 | 4.9 | % | ||||||||
| Technology & Manufacturing | 690.3 | 494.4 | 39.6 | % | ||||||||
| Education | 623.5 | 199.5 | NM | * | ||||||||
| Technical Solutions | 334.1 | 325.2 | 2.8 | % | ||||||||
| Healthcare | 206.7 | 181.6 | 13.8 | % | ||||||||
| Government Services | — | 86.5 | NM | * | ||||||||
| Total revenues | $ | 4,793.5 | $ | 3,955.6 | 21.2 | % | ||||||
| Operating profit (loss) | ||||||||||||
| Business & Industry | $ | 111.0 | $ | 100.4 | 10.5 | % | ||||||
| Aviation | 20.6 | 16.8 | 23.0 | % | ||||||||
| Technology & Manufacturing | 49.8 | 35.8 | 39.2 | % | ||||||||
| Education | 31.8 | 11.1 | NM | * | ||||||||
| Technical Solutions | 24.9 | 27.5 | (9.4 | )% | ||||||||
| Healthcare | 7.9 | 7.7 | 2.8 | % | ||||||||
| Government Services | (0.8 | ) | 21.8 | NM | * | |||||||
| Corporate | (127.3 | ) | (118.5 | ) | 7.5 | % | ||||||
| Adjustment for income from unconsolidated affiliates, net, included in Aviation and Government Services | (2.5 | ) | (3.4 | ) | (27.4 | )% | ||||||
| Adjustment for tax deductions for energy efficient government buildings, included in Technical Solutions | (2.6 | ) | (1.8 | ) | 48.8 | % | ||||||
| Total operating profit | 112.9 | 97.4 | 15.9 | % | ||||||||
| Income from unconsolidated affiliates, net | 2.5 | 3.6 | (29.3 | )% | ||||||||
| Interest expense | (41.0 | ) | (9.1 | ) | NM | * | ||||||
| Income from continuing operations before income taxes | 74.4 | 91.9 | (19.1 | )% | ||||||||
| Income tax benefit (provision) | 12.7 | (11.3 | ) | NM | * | |||||||
| Income from continuing operations | 87.1 | 80.6 | 8.0 | % | ||||||||
| Income (loss) from discontinued operations, net of taxes | 1.0 | (73.2 | ) | NM | * | |||||||
| Net income | $ | 88.1 | $ | 7.4 | NM | * | ||||||
* Not meaningful (due to variance greater than or equal to +/-100%)
| 13 |
ABM INDUSTRIES INCORPORATED AND SUBSIDIARIES
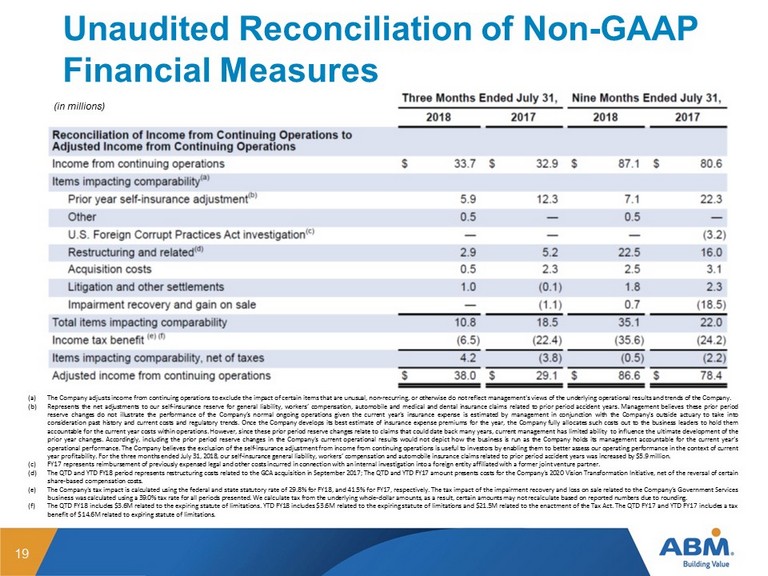
RECONCILIATIONS OF NON-GAAP FINANCIAL MEASURES (UNAUDITED)
| (in millions, except per share amounts) | Three Months Ended July 31, | Nine Months Ended July 31, | ||||||||||||||
| 2018 | 2017 | 2018 | 2017 | |||||||||||||
| Reconciliation of Income from Continuing Operations to Adjusted Income from Continuing Operations | ||||||||||||||||
| Income from continuing operations | $ | 33.7 | $ | 32.9 | $ | 87.1 | $ | 80.6 | ||||||||
| Items impacting comparability(a) | ||||||||||||||||
| Prior year self-insurance adjustment(b) | 5.9 | 12.3 | 7.1 | 22.3 | ||||||||||||
| Other | 0.5 | — | 0.5 | — | ||||||||||||
| U.S. Foreign Corrupt Practices Act investigation(c) | — | — | — | (3.2 | ) | |||||||||||
| Restructuring and related(d) | 2.9 | 5.2 | 22.5 | 16.0 | ||||||||||||
| Acquisition costs | 0.5 | 2.3 | 2.5 | 3.1 | ||||||||||||
| Litigation and other settlements | 1.0 | (0.1 | ) | 1.8 | 2.3 | |||||||||||
| Impairment recovery and gain on sale | — | (1.1 | ) | 0.7 | (18.5 | ) | ||||||||||
| Total items impacting comparability | 10.8 | 18.5 | 35.1 | 22.0 | ||||||||||||
| Income tax benefit (e) (f) | (6.5 | ) | (22.4 | ) | (35.6 | ) | (24.2 | ) | ||||||||
| Items impacting comparability, net of taxes | 4.2 | (3.8 | ) | (0.5 | ) | (2.2 | ) | |||||||||
| Adjusted income from continuing operations | $ | 38.0 | $ | 29.1 | $ | 86.6 | $ | 78.4 | ||||||||
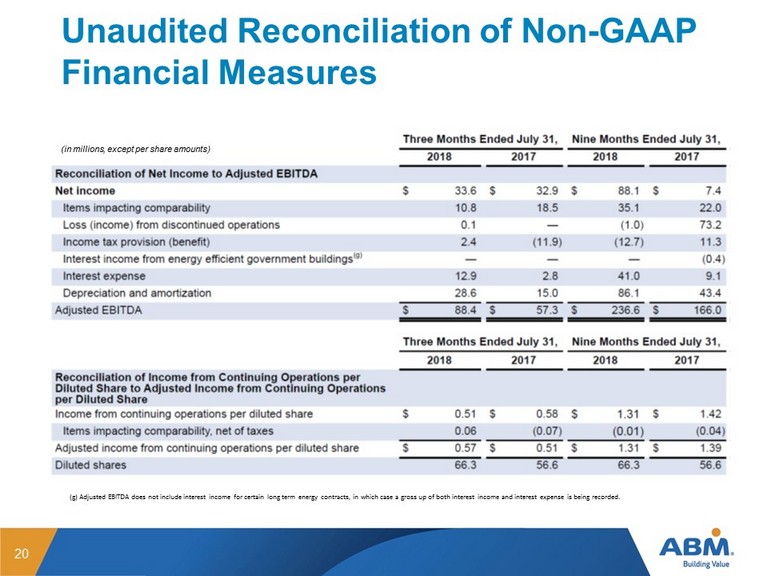
| Three Months Ended July 31, | Nine Months Ended July 31, | |||||||||||||||
| 2018 | 2017 | 2018 | 2017 | |||||||||||||
| Reconciliation of Net Income to Adjusted EBITDA | ||||||||||||||||
| Net income | $ | 33.6 | $ | 32.9 | $ | 88.1 | $ | 7.4 | ||||||||
| Items impacting comparability | 10.8 | 18.5 | 35.1 | 22.0 | ||||||||||||
| Loss (income) from discontinued operations | 0.1 | — | (1.0 | ) | 73.2 | |||||||||||
| Income tax provision (benefit) | 2.4 | (11.9 | ) | (12.7 | ) | 11.3 | ||||||||||
| Interest income from energy efficient government buildings(g) | — | — | — | (0.4 | ) | |||||||||||
| Interest expense | 12.9 | 2.8 | 41.0 | 9.1 | ||||||||||||
| Depreciation and amortization | 28.6 | 15.0 | 86.1 | 43.4 | ||||||||||||
| Adjusted EBITDA | $ | 88.4 | $ | 57.3 | $ | 236.6 | $ | 166.0 | ||||||||
| Three Months Ended July 31, | Nine Months Ended July 31, | |||||||||||||||
| 2018 | 2017 | 2018 | 2017 | |||||||||||||
| Reconciliation of Income from Continuing Operations per Diluted Share to Adjusted Income from Continuing Operations per Diluted Share | ||||||||||||||||
| Income from continuing operations per diluted share | $ | 0.51 | $ | 0.58 | $ | 1.31 | $ | 1.42 | ||||||||
| Items impacting comparability, net of taxes | 0.06 | (0.07 | ) | (0.01 | ) | (0.04 | ) | |||||||||
| Adjusted income from continuing operations per diluted share | $ | 0.57 | $ | 0.51 | $ | 1.31 | $ | 1.39 | ||||||||
| Diluted shares | 66.3 | 56.6 | 66.3 | 56.6 | ||||||||||||
(a) The Company adjusts income from continuing operations to exclude the impact of certain items that are unusual, non-recurring, or otherwise do not reflect management's views of the underlying operational results and trends of the Company.
(b) Represents the net adjustments to our self-insurance reserve for general liability, workers’ compensation, automobile and medical and dental insurance claims related to prior period accident years. Management believes these prior period reserve changes do not illustrate the performance of the Company’s normal ongoing operations given the current year's insurance expense is estimated by management in conjunction with the Company's outside actuary to take into consideration past history and current costs and regulatory trends. Once the Company develops its best estimate of insurance expense premiums for the year, the Company fully allocates such costs out to the business leaders to hold them accountable for the current year costs within operations. However, since these prior period reserve changes relate to claims that could date back many years, current management has limited ability to influence the ultimate development of the prior year changes. Accordingly, including the prior period reserve changes in the Company's current operational results would not depict how the business is run as the Company holds its management accountable for the current year’s operational performance. The Company believes the exclusion of the self-insurance adjustment from income from continuing operations is useful to investors by enabling them to better assess our operating performance in the context of current year profitability. For the three months ended July 31, 2018, our self-insurance general liability, workers’ compensation and automobile insurance claims related to prior period accident years was increased by $5.9 million.
(c) FY17 represents reimbursement of previously expensed legal and other costs incurred in connection with an internal investigation into a foreign entity affiliated with a former joint venture partner.
(d) The QTD and YTD FY18 period represents restructuring costs related to the GCA acquisition in September 2017; The QTD and YTD FY17 amount presents costs for the Company's 2020 Vision Transformation Initiative, net of the reversal of certain share-based compensation costs.
(e) The Company's tax impact is calculated using the federal and state statutory rate of 29.8% for FY18, and 41.5% for FY17, respectively. The tax impact of the impairment recovery and loss on sale related to the Company’s Government Services business was calculated using a 39.0% tax rate for all periods presented. We calculate tax from the underlying whole-dollar amounts, as a result, certain amounts may not recalculate based on reported numbers due to rounding.
(f)The QTD FY18 includes $3.6M related to the expiring statute of limitations. YTD FY18 includes $3.6M related to the expiring statute of limitations and $21.5M related to the enactment of the Tax Act. The QTD FY17 and YTD FY17 includes a tax benefit of $14.6M related to expiring statute of limitations.
(g) Adjusted EBITDA does not include interest income for certain long term energy contracts, in which case a gross up of both interest income and interest expense is being recorded.
| 14 |
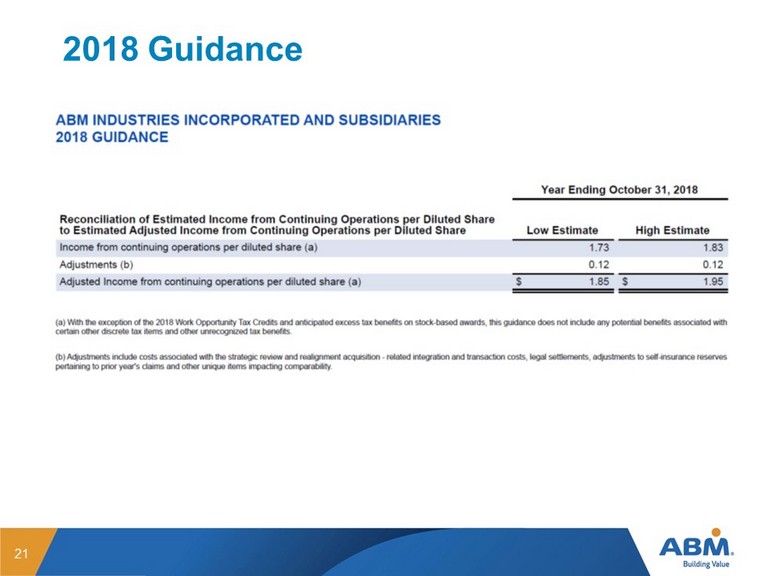
ABM INDUSTRIES INCORPORATED AND SUBSIDIARIES
2018 GUIDANCE
| Year Ending October 31, 2018 | ||||||||
| Reconciliation of Estimated Income from Continuing Operations per Diluted Share to Estimated Adjusted Income from Continuing Operations per Diluted Share | Low Estimate | High Estimate | ||||||
| Income from continuing operations per diluted share (a) | 1.73 | 1.83 | ||||||
| Adjustments (b) | 0.12 | 0.12 | ||||||
| Adjusted Income from continuing operations per diluted share (a) | $ | 1.85 | $ | 1.95 | ||||
(a) With the exception of the 2018 Work Opportunity Tax Credits and anticipated excess tax benefits on stock-based awards, this guidance does not include any potential benefits associated with certain other discrete tax items and other unrecognized tax benefits.
(b) Adjustments include costs associated with the strategic review and realignment acquisition - related integration and transaction costs, legal settlements, adjustments to self-insurance reserves pertaining to prior year's claims and other unique items impacting comparability.
| 15 |
Exhibit 99.2

THIRD QUARTER 2018 SEPTEMBER 7, 2018
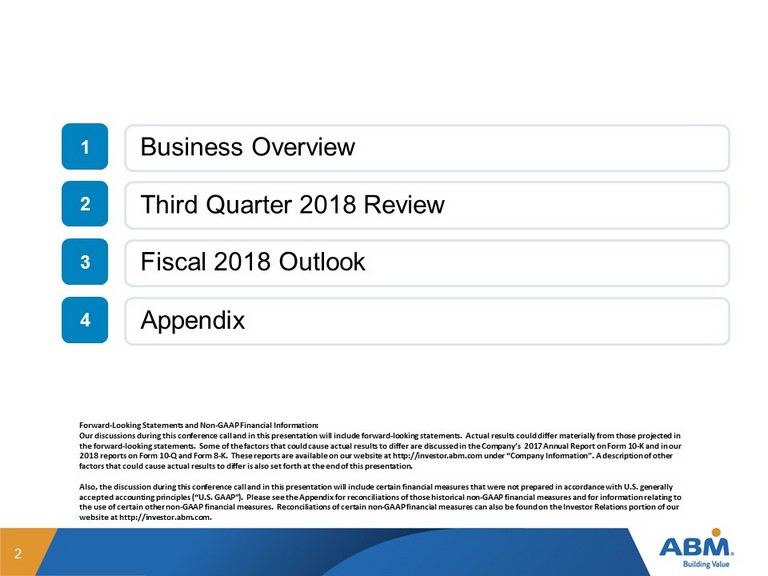
1 2 3 4 2 Business Overview Third Quarter 2018 Review Fiscal 2018 Outlook Forward - Looking Statements and Non - GAAP Financial Information: Our discussions during this conference call and in this presentation will include forward - looking statements. Actual results co uld differ materially from those projected in the forward - looking statements. Some of the factors that could cause actual results to differ are discussed in the Company’s 2 017 Annual Report on Form 10 - K and in our 2018 reports on Form 10 - Q and Form 8 - K. These reports are available on our website at http://investor.abm.com under “Company In formation”. A description of other factors that could cause actual results to differ is also set forth at the end of this presentation. Also, the discussion during this conference call and in this presentation will include certain financial measures that were n ot prepared in accordance with U.S. generally accepted accounting principles (“U.S. GAAP”). Please see the Appendix for reconciliations of those historical non - GAAP financia l measures and for information relating to the use of certain other non - GAAP financial measures. Reconciliations of certain non - GAAP financial measures can also be found on the Investor Relations portion of our website at http://investor.abm.com. Appendix

Business Overview
PURPOSE To take care of the people, spaces and places that are important to you VISION To be the clear choice in the industries we serve through engaged people MISSION To make a difference, every person, every day ABM

5 Strategically Focused on Industries Where We Can Win Business & Industry Aviation Education Healthcare Technology & Manufacturing Business & Industry Technical Solutions Shared Services, Support Functions
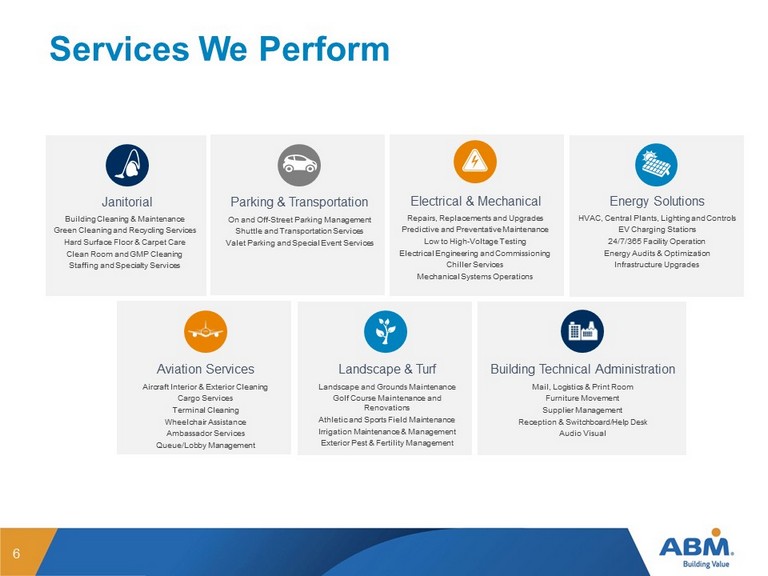
6 Services We Perform HVAC, Central Plants, Lighting and Controls EV Charging Stations 24/7/365 Facility Operation Energy Audits & Optimization Infrastructure Upgrades Energy Solutions Building Cleaning & Maintenance Green Cleaning and Recycling Services Hard Surface Floor & Carpet Care Clean Room and GMP Cleaning Staffing and Specialty Services Janitorial On and Off - Street Parking Management Shuttle and Transportation Services Valet Parking and Special Event Services Parking & Transportation Repairs, Replacements and Upgrades Predictive and Preventative Maintenance Low to High - Voltage Testing Electrical Engineering and Commissioning Chiller Services Mechanical Systems Operations Electrical & Mechanical Aviation Services Aircraft Interior & Exterior Cleaning Cargo Services Terminal Cleaning Wheelchair Assistance Ambassador Services Queue/Lobby Management Landscape and Grounds Maintenance Golf Course Maintenance and Renovations Athletic and Sports Field Maintenance Irrigation Maintenance & Management Exterior Pest & Fertility Management Landscape & Turf Mail, Logistics & Print Room Furniture Movement Supplier Management Reception & Switchboard/Help Desk Audio Visual Building Technical Administration
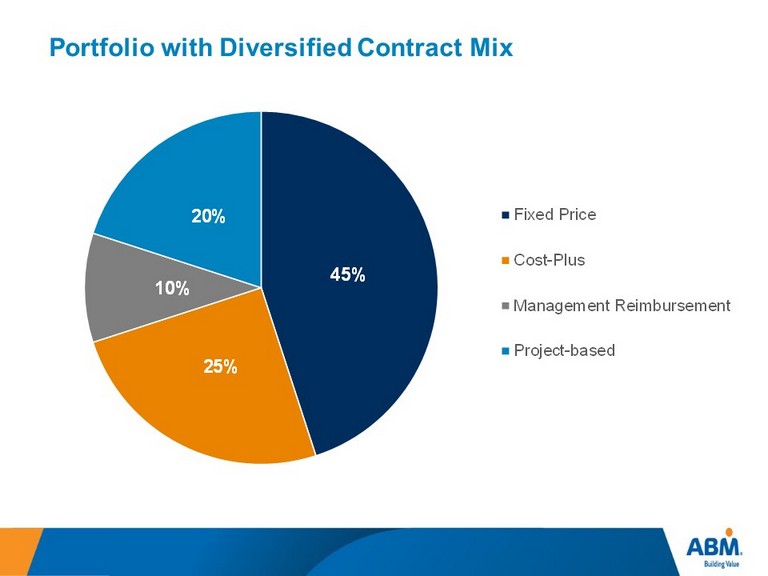
Portfolio with Diversified Contract Mix 71 45% 25% 10% 20% Fixed Price Cost-Plus Management Reimbursement Project-based

Recent Results

$1,318.4 $1,624.3 2017 2018 Q3 FY18 Revenue Third Quarter 2018 Review 9 • Q3 FY18 revenue increase of 23.2% • Q3 FY18 organic growth of 4.5%
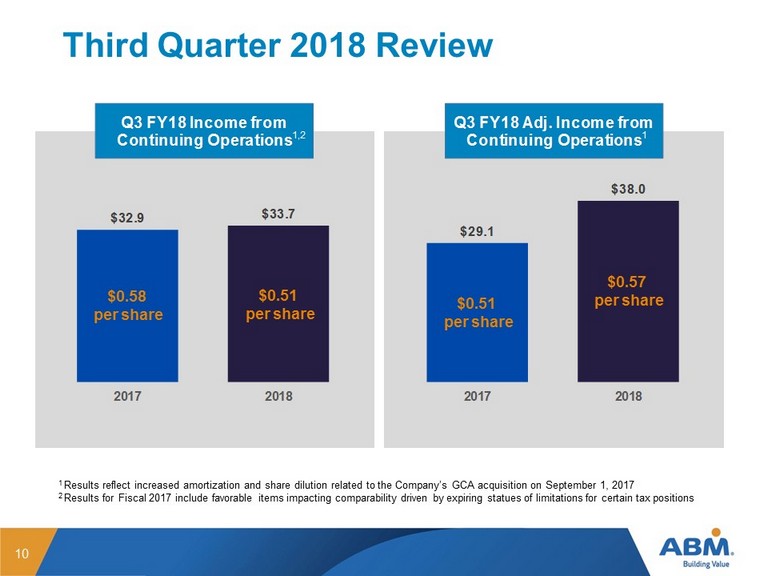
$32.9 $33.7 2017 2018 Q3 FY18 Income from Continuing Operations $29.1 $38.0 2017 2018 Q3 FY18 Adj. Income from Continuing Operations Third Quarter 2018 Review 10 $0.51 per share $0.57 per share $0.51 per share $0.58 per share 1 Results reflect increased amortization and share dilution related to the Company’s GCA acquisition o n September 1, 2017 2 Results for Fiscal 2017 include favorable items impacting comparability driven by expiring statues of limitations for certain ta x positions 1,2 1

$32.9 $33.6 2017 2018 Q3 FY18 Net Income $57.3 $88.4 2017 2018 Q3 FY18 Adj. EBITDA Third Quarter 2018 Review 11 5 .4% margin 4.3% margin $0.58 per share $0.51 per share 1,2 1 Results reflect increased amortization and share dilution related to the Company’s GCA acquisition o n September 1, 2017 2 Results for Fiscal 2017 includes favorable items impacting comparability driven by expiring statues of limitations for certai n t ax positions
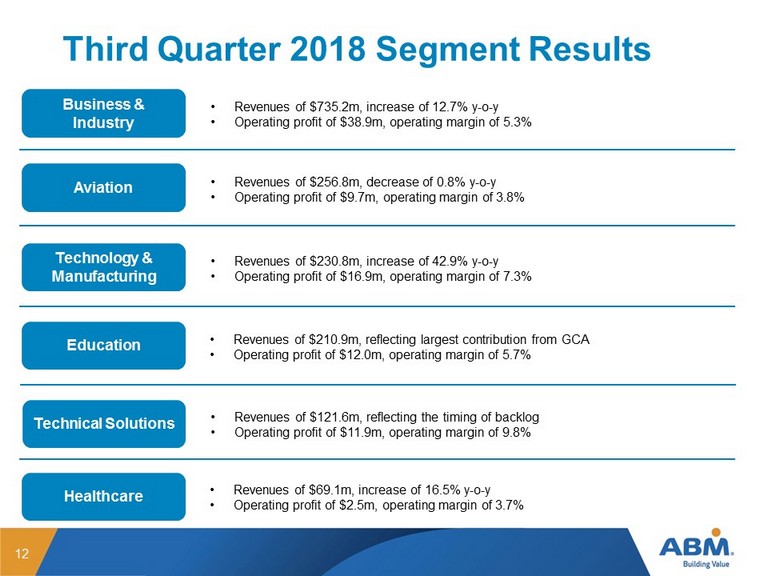
Third Quarter 2018 Segment Results 12 Business & Industry • Revenues of $735.2m, increase of 12.7% y - o - y • Operating profit of $38.9m, operating margin of 5.3% Aviation • Revenues of $256.8m, decrease of 0.8% y - o - y • Operating profit of $9.7m, operating margin of 3 .8 % Technology & Manufacturing • Revenues of $230.8m, increase of 42.9% y - o - y • Operating profit of $ 16.9 m, operating margin of 7 .3 % Education • Revenues of $210.9m, reflecting largest contribution from GCA • Operating profit of $12 .0 m, operating margin of 5.7% Technical Solutions • Revenues of $121.6m, reflecting the timing of backlog • Operating profit of $11 .9 m, operating margin of 9.8% Healthcare • Revenues of $69.1m, increase of 16.5% y - o - y • Operating profit of $2 .5 m, operating margin of 3.7%

Fiscal 2018 Guidance Outlook
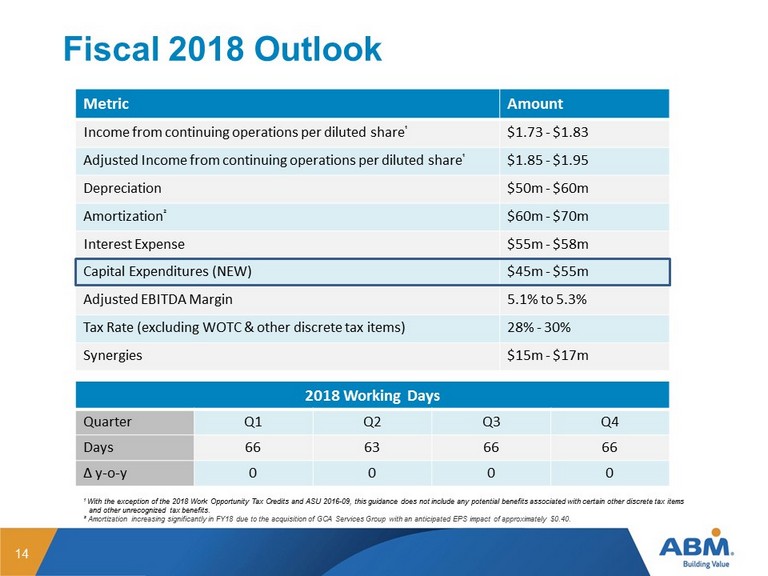
Fiscal 2018 Outlook 14 Metric Amount Income from continuing operations per diluted share ¹ $1.73 - $1.83 Adjusted Income from continuing operations per diluted share ¹ $1.85 - $1.95 Depreciation $50m - $60m Amortization ² $60m - $70m Interest Expense $55m - $58m Capital Expenditures (NEW) $45m - $55m Adjusted EBITDA Margin 5.1% to 5.3% Tax Rate (excluding WOTC & other discrete tax items) 28% - 30% Synergies $15m - $17m 1 With the exception of the 2018 Work Opportunity Tax Credits and ASU 2016 - 09, this guidance does not include any potential benefi ts associated with certain other discrete tax items and other unrecognized tax benefits. ² Amortization increasing significantly in FY18 due to the acquisition of GCA Services Group with an anticipated EPS impact of app roximately $0.40. 2018 Working Days Quarter Q1 Q2 Q3 Q4 Days 66 63 66 66 Δ y - o - y 0 0 0 0
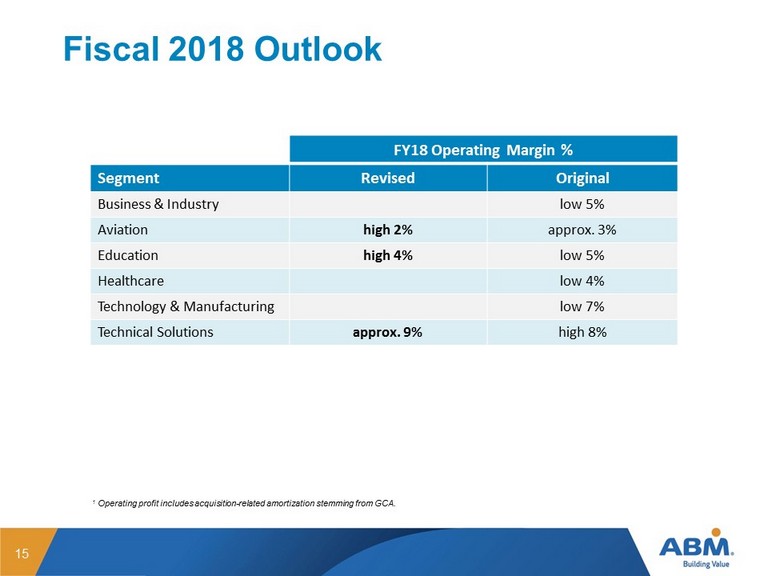
Fiscal 2018 Outlook 15 1 Operating profit includes acquisition - related amortization stemming from GCA. ¹ ¹ FY18 Operating Margin % Segment Revised Original Business & Industry low 5% Aviation high 2% approx. 3% Education high 4% low 5% Healthcare low 4% Technology & Manufacturing low 7% Technical Solutions approx. 9% high 8%

Appendix

Forward - Looking Statements This presentation contains both historical and forward - looking statements regarding ABM Industries Incorporated (“ABM”) and its subsidiaries (collectively referred to as “ABM,” “we,” “us,” “our,” or the “Company”) . We make forward - looking statements related to future expectations, estimates, and projections that are uncertain and often contain words such as “anticipate,” “believe,” “could,” “estimate,” “expect,” “forecast,” “intend,” “likely,” “may,” “outlook,” “plan,” “predict,” “should,” “target,” or other similar words or phrases . These statements are not guarantees of future performance and are subject to known and unknown risks, uncertainties, and assumptions that are difficult to predict . Particular risks and uncertainties that could cause our actual results to be materially different from those expressed in our forward - looking statements include : ( 1 ) we may not realize the growth opportunities and cost synergies that are anticipated from the acquisition of GCA Services Group (“GCA”) ; ( 2 ) we have incurred a substantial amount of debt to complete the acquisition of GCA . To service our debt we will require a significant amount of cash . Our ability to generate cash depends on many factors beyond our control . We also depend on the profitability of our subsidiaries to satisfy our cash needs . If we cannot generate the required cash, we may not be able to make the necessary payments required to service our indebtedness or we may be required to suspend certain discretionary payments, including our dividend ; ( 3 ) changes to our businesses, operating structure, financial reporting structure, or personnel relating to the implementation of our 2020 Vision strategic transformation initiative, including our move to our Enterprise Services Center, may not have the desired effects on our financial condition and results of operations ; ( 4 ) our success depends on our ability to gain profitable business despite competitive pressures and to preserve long - term client relationships ; ( 5 ) our business success depends on our ability to attract and retain qualified personnel and senior management ; ( 6 ) our use of subcontractors or joint venture partners to perform work under customer contracts exposes us to liability and financial risk ; ( 7 ) our international business involves risks different from those we face in the United States that could have an effect on our results of operations and financial condition ; ( 8 ) unfavorable developments in our class and representative actions and other lawsuits alleging various claims could cause us to incur substantial liabilities ; ( 9 ) we insure our insurable risks through a combination of insurance and self - insurance and we retain a substantial portion of the risk associated with expected losses under these programs, which exposes us to volatility associated with those risks, including the possibility that changes in estimates of ultimate insurance losses could result in a material charge against our earnings ; ( 10 ) our risk management and safety programs may not have the intended effect of reducing our liability for personal injury or property loss ; ( 11 ) impairment of goodwill and long - lived assets could have a material adverse effect on our financial condition and results of operations ; ( 12 ) changes in general economic conditions, including changes in energy prices, government regulations, or changing consumer preferences, could reduce the demand for facility services and, as a result, reduce our earnings and adversely affect our financial condition ; ( 13 ) our income tax provision and income tax liabilities could be adversely affected by the jurisdictional mix of earnings, changes in valuations of deferred tax assets and liabilities, and changes in tax treaties, laws, and regulations, including the U . S . Tax Cuts and Jobs Act of 2017 , which effected significant changes to the U . S . corporate income tax system ; ( 14 ) we could be subject to cyber - security risks, information technology interruptions, and business continuity risks ; ( 15 ) a significant number of our employees are covered by collective bargaining agreements that could expose us to potential liabilities in relationship to our participation in multiemployer pension plans, requirements to make contributions to other benefit plans, and the potential for strikes, work slowdowns or similar activities, and union - organizing drives ; ( 16 ) if we fail to maintain proper and effective internal control over financial reporting in the future, our ability to produce accurate and timely financial statements could be negatively impacted, which could harm our operating results and investors’ perceptions of our company and, as a result, the value of our common stock ; ( 17 ) our business may be negatively impacted by adverse weather conditions ; ( 18 ) catastrophic events, disasters, and terrorist attacks could disrupt our services ; and ( 19 ) actions of activist investors could disrupt our business . The list of factors above is illustrative and by no means exhaustive . Additional information regarding these and other risks and uncertainties we face is contained in our Annual Report on Form 10 - K for the year ended October 31 , 2017 and in other reports we file from time to time with the Securities and Exchange Commission (including all amendments to those reports) . We urge readers to consider these risks and uncertainties in evaluating our forward - looking statements . We caution readers not to place undue reliance upon any such forward - looking statements, which speak only as of the date made . We undertake no obligation to publicly update any forward - looking statements, whether as a result of new information, future events, or otherwise, except as required by law . 17

Use of Non - GAAP Financial Information To supplement ABM’s consolidated financial information, the Company has presented income from continuing operations and income from continuing operations per diluted share as adjusted for items impacting comparability, for the third quarter of fiscal years 2018 and 2017 . These adjustments have been made with the intent of providing financial measures that give management and investors a better understanding of the underlying operational results and trends as well as ABM’s operational performance . In addition, the Company has presented earnings before income from discontinued operations, net of taxes, interest, taxes, depreciation and amortization and excluding items impacting comparability (adjusted EBITDA) for the third quarter of fiscal years 2018 and 2017 . Adjusted EBITDA is among the indicators management uses as a basis for planning and forecasting future periods . The presentation of these non - GAAP financial measures is not meant to be considered in isolation or as a substitute for financial statements prepared in accordance with accounting principles generally accepted in the United States of America . (See accompanying financial tables for supplemental financial data and corresponding reconciliations to certain GAAP financial measures . ) 18
Unaudited Reconciliation of Non - GAAP Financial Measures 19 (a) The Company adjusts income from continuing operations to exclude the impact of certain items that are unusual, non - recurring, or otherwise do not reflect management's views of the underlying operational results and trends of the Company . (b) Represents the net adjustments to our self - insurance reserve for general liability, workers’ compensation, automobile and medical and dental insurance claims related to prior period accident years . Management believes these prior period reserve changes do not illustrate the performance of the Company’s normal ongoing operations given the current year's insurance expense is estimated by management in conjunction with the Company's outside actuary to take into consideration past history and current costs and regulatory trends . Once the Company develops its best estimate of insurance expense premiums for the year, the Company fully allocates such costs out to the business leaders to hold them accountable for the current year costs within operations . However, since these prior period reserve changes relate to claims that could date back many years, current management has limited ability to influence the ultimate development of the prior year changes . Accordingly, including the prior period reserve changes in the Company's current operational results would not depict how the business is run as the Company holds its management accountable for the current year’s operational performance . The Company believes the exclusion of the self - insurance adjustment from income from continuing operations is useful to investors by enabling them to better assess our operating performance in the context of current year profitability . For the three months ended July 31 , 2018 , our self - insurance general liability, workers’ compensation and automobile insurance claims related to prior period accident years was increased by $ 5 . 9 million . (c) FY 17 represents reimbursement of previously expensed legal and other costs incurred in connection with an internal investigation into a foreign entity affiliated with a former joint venture partner . (d) The QTD and YTD FY 18 period represents restructuring costs related to the GCA acquisition in September 2017 ; The QTD and YTD FY 17 amount presents costs for the Company's 2020 Vision Transformation Initiative, net of the reversal of certain share - based compensation costs . (e) The Company's tax impact is calculated using the federal and state statutory rate of 29 . 8 % for FY 18 , and 41 . 5 % for FY 17 , respectively . The tax impact of the impairment recovery and loss on sale related to the Company’s Government Services business was calculated using a 39 . 0 % tax rate for all periods presented . We calculate tax from the underlying whole - dollar amounts, as a result, certain amounts may not recalculate based on reported numbers due to rounding . (f) The QTD FY 18 includes $ 3 . 6 M related to the expiring statute of limitations . YTD FY 18 includes $ 3 . 6 M related to the expiring statute of limitations and $ 21 . 5 M related to the enactment of the Tax Act . The QTD FY 17 and YTD FY 17 includes a tax benefit of $ 14 . 6 M related to expiring statute of limitations . (in millions)
Unaudited Reconciliation of Non - GAAP Financial Measures 20 (g) Adjusted EBITDA does not include interest income for certain long term energy contracts, in which case a gross up of both interest income and interest expense is being recorded . (in millions, except per share amounts)
2018 Guidance 21

THIRD QUARTER 2018 SEPTEMBER 7, 2018
Data Provided by Refinitiv. Minimum 15 minutes delayed.